

About
The Data Atlas of the World has been created by hand using Adobe Illustrator for visualization and Microsoft Excel for analysis. All countries, labels and graphic details have been meticulously placed and refined to maximize visual understanding and representational accuracy.
All content has been produced by Carrie Osgood, a Pulitzer Prize-nominated visual data journalist, creative communications strategist and university art & design professor. Throughout her career, Carrie has created customized work for major international organizations including the United Nations, the Associated Press, Columbia University's Earth Institute, the Guardian and Interbrand.
To learn more about Carrie, please visit her consulting business CLO-Communications.com and her online portfolio CarrieOsgood.com.
NOTES ON THE DATA
The categorized regions that group countries into Northern America, Latin America & Caribbean, Europe, Africa, Asia and Oceania are defined by the United Nations, Department of Economic and Social Affairs, Population Division, World Population Prospects.
Kosovo is recognized by the World Bank, but not always by the United Nations, so its data may be included in Serbia when not available.
The Palestinian Territories (Pal.) incorporates the West Bank and Gaza Strip.
Territories and regions around the world that are not shown nor labeled do not have available data.
Population data has been adjusted for each year, matching the sources referenced unless stated otherwise.
ORIGIN STORY
“This is the best, simplest map of world religions ever”
Carrie created the first map in this series during the winter of 2011-2012 after the United Nations Population Fund (UNFPA) asked her to look at their data and create various infographics supporting their 7 Billion Actions initiative. While they never purchased her infographic map showing the population of the world, they did hire her as a creative consultant who has collaborated with them on a variety of projects over the years.
In the fall of 2012 while covering the U.S. Presidential Elections for the Associated Press, she reached out to the World Religions Database for assistance producing an infographic profiling Mormonism, GOP candidate Mitt Romney’s religion. They generously provided her with a complementary temporary subscription to all of their data in exchange for a source credit. Curious to see what their compelling data might look like on a global scale, months later she integrated their figures with her world population map she created a year earlier as a personal project for fun, and it lived in obscurity for years.
Flash forward six years to March 2019, and Frank Jacobs of Strange Maps discovered her personal project online, and he unexpectedly wrote an article about her Major World Religions map for Big Think, calling it “the best, simplest map of world religions ever.” Since then, her infographic map of Major World Religions has gone viral with thousands of active viewers, appearing in numerous publications and blog posts around the world.
Read some of the articles:
Big Think
World Economic Forum
Magnet / Xataka (Spanish/Español)
Open Culture
The outpouring of excitement and interest in the infographic map inspired the development of this Data Atlas of the World.
Please note that due to the unexpected nature of the Strange Maps profile, combined with dated technology, some critical information including the color keys (“Atheist/Agnostic” not “None”) and sourcing got lost in translation with some of the online responses to the Big Think article.
Subscribe or login to view the most recent version of the world religions map showing 2020 data.
BACKGROUND
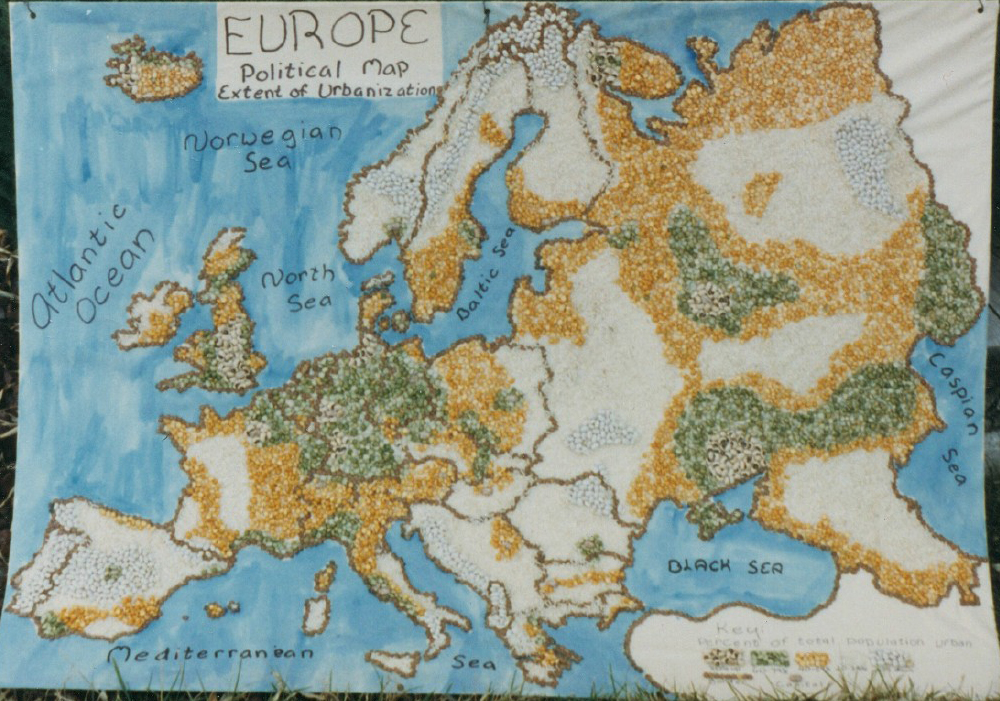
The Data Atlas of the World combines Carrie’s life-long passions of Art & Design, Education, Storytelling and the World at large. She has explored more than 55 countries on six continents and thrives when creating connections that educate and inspire. Enjoy one of her earlier artistic maps, which she created when she was 11 years old, made out of peas, beans and rice glued on large poster board:
Copyright © 2019-2024 Carrie Osgood | CLO Communications LLC
Reproducing or repurposing content, and any commercial usage, is prohibited without written consent.